
能源研究院-《世界能源统计年鉴2026》Statistical Review of World Energy 2026

3.0
2026-07-10
14
4
12.05MB
88 页
10龙币
侵权投诉

1 Energy Institute Statistical Review of World Energy 2026
Statistical
Review
of World
Energy
2026 | 75th edition
In collaboration with
In partnership with

Energy Institute Statistical Review of World Energy 2026 1
Back to contents
Introduction
2 Foreword
4 2025 Key highlights
75th Anniversary Analysis
6 Insight 1: Import dependence and exposure in 2025
8 Insight 2: How the 1970s oil shocks shifted energy
patterns
10 Insight 3: Renewables as a tool for energy security
12 Insight 4: The changing drivers of global energy
demand
14 Insight 5: Are countries weakening the link between
fossil fuels and economic growth?
16 Regional overview
18 Country prole: China
19 Country prole: US
20 Country prole: India
21 Country prole: EU
Total energy supply and carbon
22 Foreword
23 Supply
24 Supply by fuel
25 Supply per capita
Carbon
26 Carbon dioxide emissions from energy
27 Carbondioxideemissionsfromnaturalgasaring
28 Carbon dioxide equivalent emissions
29 Carbon capture, usage and storage (CCUS)
29 Prices
Oil
30 Foreword
31 Production in thousands of barrels per day
32 Production in million tonnes
33 Crude oil and condensate production
34 Natural gas liquids production
35 Total liquids consumption
36 Consumption in thousands of barrels per day
37 Consumption in exajoules
38 Regional consumption
40 Spot crude prices
40 Crude oil prices 1861-2025
41 Reningcapacity
42 Renerythroughput
43 Trade movements
43 Trade in 2024 and 2025
44 Inter-area movements 2025 – crude trade
45 Inter-areamovements2025–renedproduct
Natural gas
46 Foreword
47 Production in billion cubic metres
48 Production in exajoules
49 Consumption in billion cubic metres
50 Consumption in exajoules
51 Prices
51 Hydrogen production
52 Inter-regional trade
53 LNG imports
53 LNG exports
54 Trade movements – LNG
55 Trade movements – pipeline
Coal
56 Foreword
57 Production in million tonnes
58 Production in exajoules
59 Trade movements
59 Inter-area movements
60 Prices
61 Consumption
Electricity
62 Foreword
63 Generation
64 Generation by fuel
64 Data centre power demand
65 Grid-scale battery energy storage systems (BESS)
Hydroelectricity
66 Generation
Renewable energy
67 Total energy supply
68 Total power energy supply
69 Solar installed capacity
70 Wind installed capacity
71 Solar installed capacity by type
72 Solar PV behind-the-meter and off-grid
installed capacity
73 Wind installed capacity by type
74 Generation by source
75 Biofuels production
76 Biofuels consumption
Nuclear
77 Generation
Key minerals
78 Foreword
79 Production and reserves
80 Prices
Methodology
81 More detail on the methodology
Appendices
83 Approximate conversion factors
84 Denitions
84 More information
85 Acknowledgements
86 Explore the report online
Contents

Energy Institute Statistical Review of World Energy 2026 2
Back to contents
ForewordForeword
The Energy Institute (EI), in partnership with Ember and in collaboration with
Kearney and KPMG, is proud to produce the 75th edition of the Statistical Review
of World Energy, providing the first, full, freely-available analysis of global
energy markets for the prior year.
AstheStatisticalReviewmarksits75thanniversary,itreectsnot
only a unique dataset, but the work of generations of thinkers who
have shaped how the world understands energy. From its stewardship
under bp, to its evolution today under the Energy Institute, the
Statistical Review has remained a trusted guide through moments of
profound change.
Today, the EI team carry on that legacy, working with our partners to ensure the
Reviewremainsrigorous,relevantandindependent.Itsdeningprinciples–full,rst,free
and fair – continue to underpin an objective view of the shape of the global energy system.
In the last 75 years, we have seen unprecedented global growth in population, prosperity
and human health. In this period, global energy demand has increased six-fold, the world
economy has grown 14-fold and average life expectancy has increased from 47 years to
74 years. It has been a remarkable journey.
Overtheyears,theStatisticalReviewhasdocumentedhowenergyowsrespondto
geopolitics, technology and demand. From the oil shocks of the 1970s to today’s tensions
around the Strait of Hormuz, the system remains shaped by physical resources and the
routes that deliver them.
By bringing together global data on production, consumption, trade and emissions, the
Statistical Review provides a trusted foundation for understanding how our energy system
reallyis.Inaworlddenedbyvolatilityandtransition,theReviewremainsaglobalpublic
good: an independent, evidence-based anchor to inform decisions and support a just,
secure and low carbon energy transition.
Andy Brown OBE FEI
President, Energy Institute
Dr Nick Wayth FEI
Chief Executuve,
Energy Institute
Ember
The geopolitical fault lines of global energy markets are once again exposed. As vulnerable
fossilsupplyroutesfacedisruption,solar,batteriesandelectricationadvanceinbothmature
and emerging economies.
The 75 years of energy history documented in this Review have largely been a fossil-powered
growth story. Today, the data show that supply growth is increasingly renewable and electric.
Electricitycontinuestooutpacetotalenergysupplygrowth,particularlyinAsia.Fortherst
time, renewables – driven largely by solar – were the largest source of new energy supply.
Thetransitionfrommoleculestoelectronsisfundamentallyanefciencyadvance.Anelectric
vehicle requires less than a third of the energy of an internal combustion equivalent, while
solaristwotothreetimesmoreefcientthanthermalpower.Currently,two-thirdsofglobal
energy supply is wasted as heat.
Amid the second major fossil shock in four years, this report recalls the 1970s, which
permanently altered the trajectory of global oil demand. The logic of energy security is
now expanding, from diversifying fuel supply to reducing dependency. Capital investments
in electro-technologies provide predictable domestic energy for decades, in contrast to
ongoing, volatile commodity costs.
Policymakers can navigate these evolving risks by playing to domestic strengths to improve
long-term security and economic competitiveness. More than ever, trusted data and foresight
are critical. Ember is proud to be a strategic partner in the Energy Institute Statistical Review
of World Energy, upholding the legacy of impartial data collection and equipping decision-
makers to build a secure energy future.
Phil MacDonald
ChiefExecutiveOfcer,
Ember

Energy Institute Statistical Review of World Energy 2026 3
Back to contents
Kearney
TheEnergyInstituteStatisticalReviewofWorldEnergy2026dataconrmsthatrenewable
energy is scaling at unprecedented speed, but delivery challenges are becoming more visible.
Solar was the standout performer, increasing by around 30% year-on-year. More broadly,
renewableswerethelargestsourceoftotalenergysupplygrowthforthersttimeoutside
of a recession, with solar power accounting for 72% of this growth.
This marks a structural shift from a system where clean power supplements fossil fuels, to
one where it increasingly substitutes them. Superior economics combined with low project
complexity are key driving factors behind this stellar growth. However, at the same time,
total energy demand continued to rise, and all energy sources, including fossil fuels, reached
record levels.
Thistensiondenesthenextphaseofthetransition.Thechallengeisnolongerwhether
renewables can grow, but whether systems can keep pace with that growth. Grid
infrastructure,storagecapacityandexibilitysolutionsarenotscalingatthesamerate
as generation, limiting the system-wide impact of record deployment.
The data also reveals increasing concentration of renewable growth. In several markets,
deployment is accelerating at a scale that is reshaping entire energy systems, while others
face constraints in capital, infrastructure and regulatory frameworks. This divergence
underscores a critical point: the pathway to tripling renewables will not be uniform, and
success will depend on execution as much as ambition.
The Statistical Review provides the evidence base for this transition, tracking not only
how fast renewables are growing, but how effectively they are reshaping the global
energy system.
The findings reveal a year in which energy demand
continues to surge, low carbon electricity reaches a historic
milestone, and transition pathways diverge sharply across
regions – all against a backdrop of rising geopolitical risk.
Maria de Kleijn
Europe Lead,
Sustainability; and
Partner, Kearney
Wafa Jafri
Partner and UK Lead
for Energy and Natural
Resources Strategy,
KPMG in the UK
KPMG
The global energy system is fragmenting – fast. For decades, the direction of travel felt
broadly shared with a world moving, however unevenly, toward cleaner and integrated
system. That consensus is fracturing and countries are now making fundamentally different
choices about how they power their economies, driven by a common imperative: resilience.
While renewables are still growing, the US is using its energy abundance in oil, gas and
coal production to manage energy demand growth. China is deploying renewables at
unprecedented scale while stockpiling fossil fuels as insurance. Europe is reducing fossil fuel
dependency while navigating a new reliance on critical minerals used in renewables and
LNG. The Middle East is investing in both hydrocarbon expansion and clean energy. Same
imperative of energy security but four completely different strategies.
Thisisthedeningstoryofthe75theditionoftheEnergyInstitute’sStatisticalReview
of World Energy: a world of divergent national energy choices. For businesses, the
implicationsareclear.Inanincreasinglyvolatilesystem,diversiedsupply,contractual
exibility,andreducedrelianceonsinglesourcesofcrude,gas,renedproductsandcritical
minerals are core to competitiveness. The Energy Institute’s 2026 Statistical Review provides
a valuable foundation for interpreting these trends, and KPMG International is pleased to
support this publication.

Energy Institute Statistical Review of World Energy 2026 4
Back to contents Energy Institute Statistical Review of World Energy 2026 4
2025 Key highlights
Total energy supply (TES)
Total energy supply (TES) exceeded 600EJ in 2025, a rise of
1.7% over 2024, continuing the long-term upward trend
in energy demand. Renewables were the largest source of
TESgrowthforthersttimeoutsideofarecession,with
solar power accounting for 71% of this increase. Fossil fuels
continued to expand in absolute terms and retained their
dominant position, accounting for 86% of TES. All sources
of energy supply, globally, saw increases in 2025.
Electricity
Electricity is growing in prominence in the energy system,
with electricity demand continuing to grow faster than
TES, rising 3% year-on-year.
Solar achieved 30% growth in 2025 and its share of total
power generation reached 8.7% – surpassing wind
(8.4%)forthersttimeandalmostequallingnuclear’s
share of 8.8%.
Behind solar, wind power was the second largest source
of renewables growth in 2025, increasing by 8.2%
year-on-year.
In a world that is increasingly volatile, data for the year
preceding the conflict in the Middle East provides essential
benchmarks for the energy transition.
New drivers of electricity
demand, from electric
vehicles to data centres and
AI, continued to expand the
role of electricity in 2025
In absolute terms, the
increase in US emissions was
four times greater than that
of China
Carbon emissions
Global CO2 emissions from the energy sector rose by 1.1%
to 35,806.2 million tonnes of CO2. More than a third of
that rise was from the US. Europe’s CO2 emissions from the
energy sector increased by 0.5%. North America had the
second-largest regional growth rate for energy emissions at
2.7% (after Africa at 2.8%) and largest growth in absolute
terms of 152.3 million tonnes of CO2, bucking the region’s
10-year decline trend of -0.7%.
Total emissions including energy and other sources rose by
1.1% to 41,000 million tonnes of CO2.

声明:本站是提供个人知识管理的网络存储空间,所有内容均由用户发布,不代表本站观点。请注意甄别内容中的联系方式、诱导购买等信息,谨防诈骗。如发现有害或侵权内容,请点击侵权投诉。
相关推荐
-
烟气脱硝及催化剂知识10.10
 2024-09-14 83
 -
双极制氢
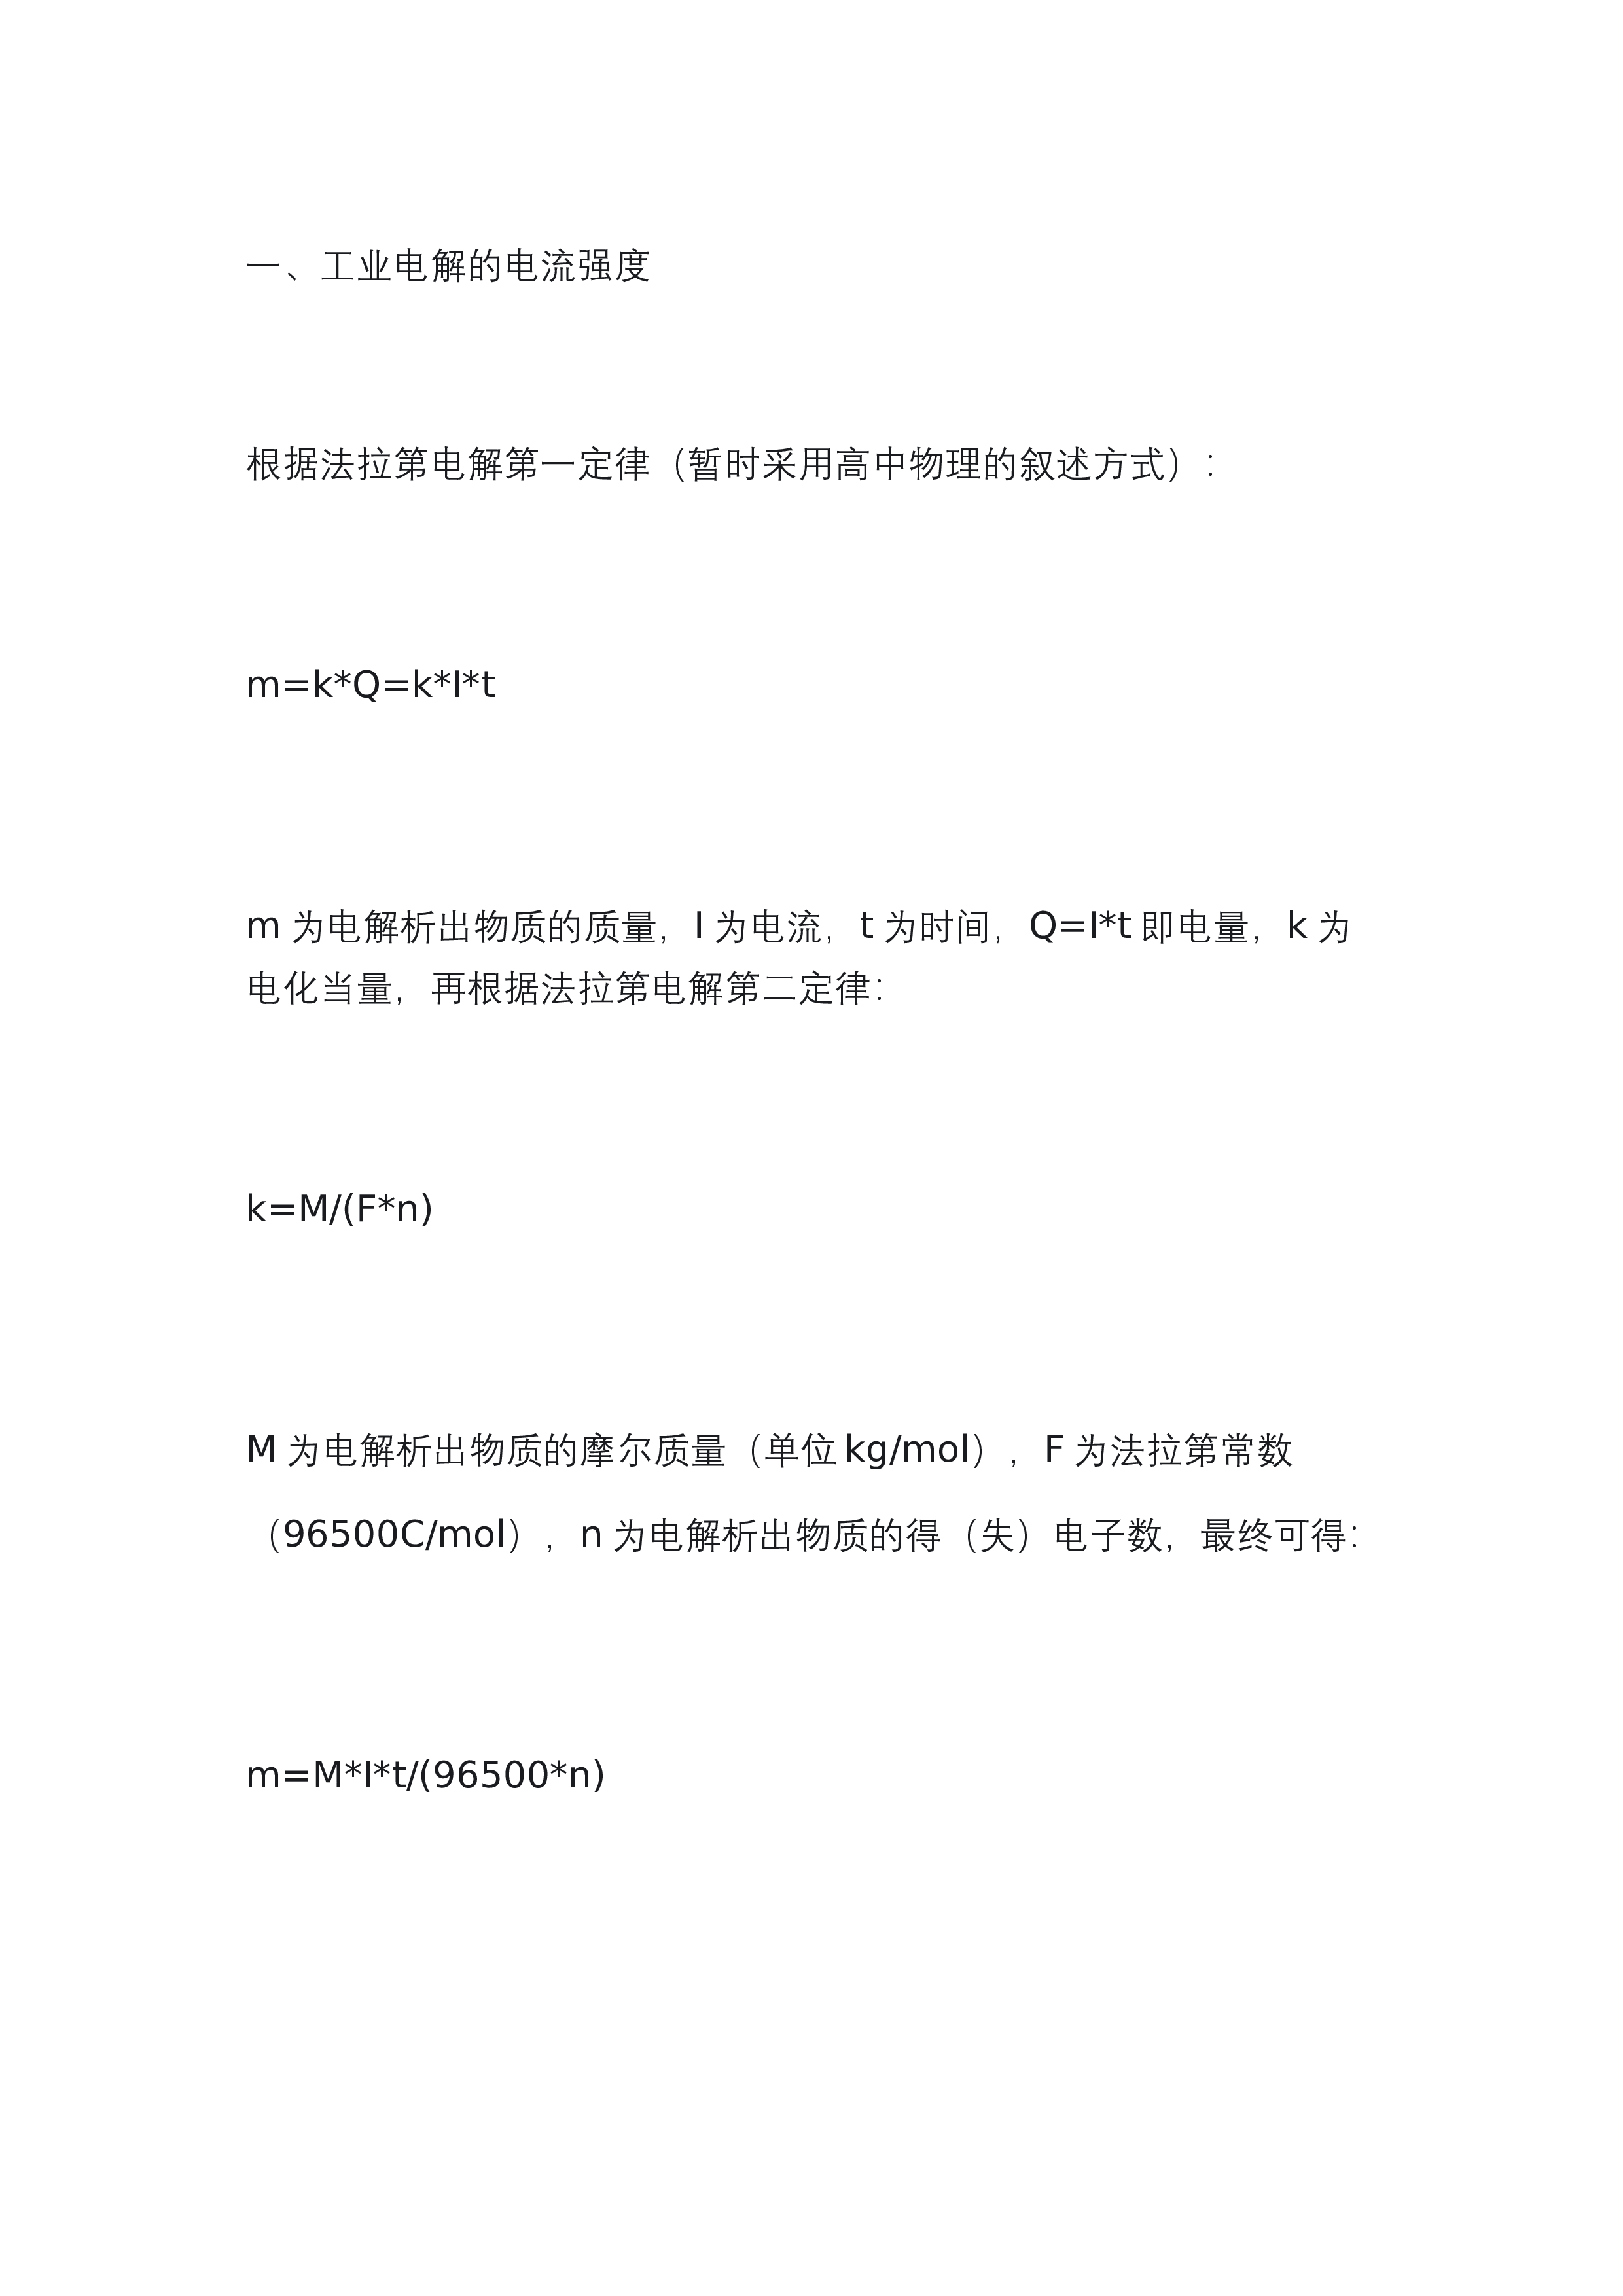
 2024-09-26 97
 -
镍锌无隔膜燃料电池简介
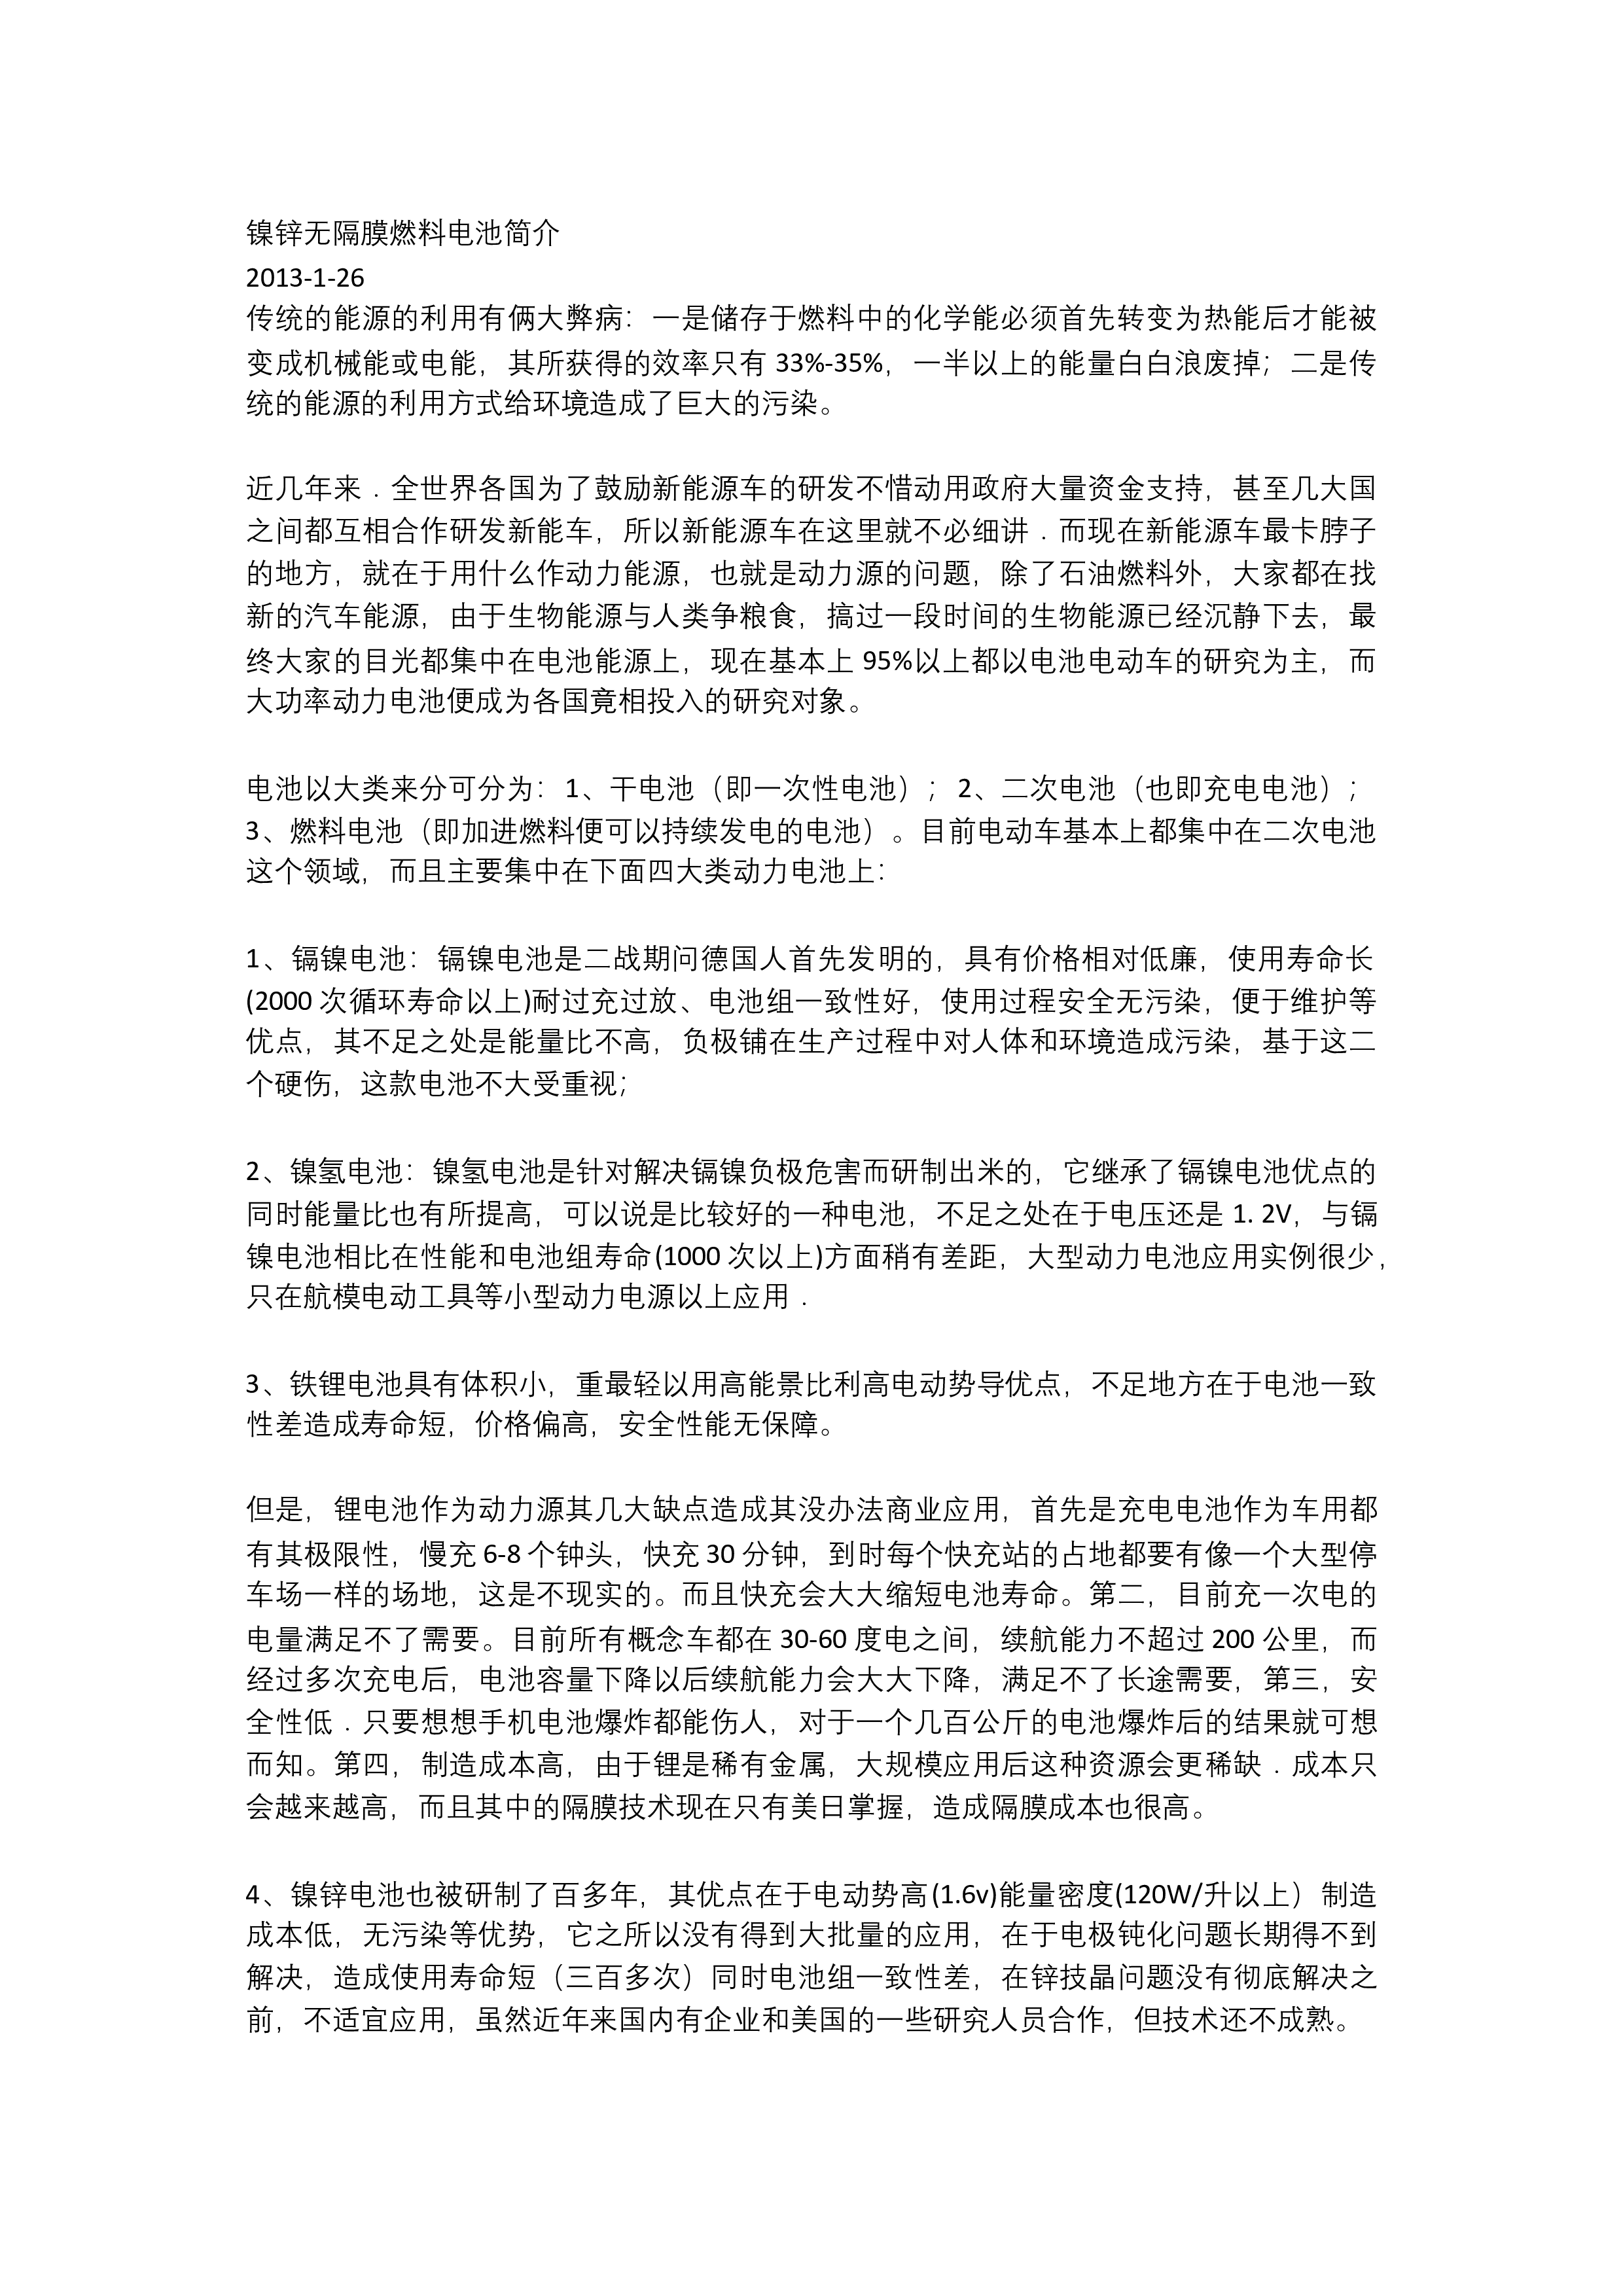 2024-10-05 72
 -
附图:计算机监控系统图
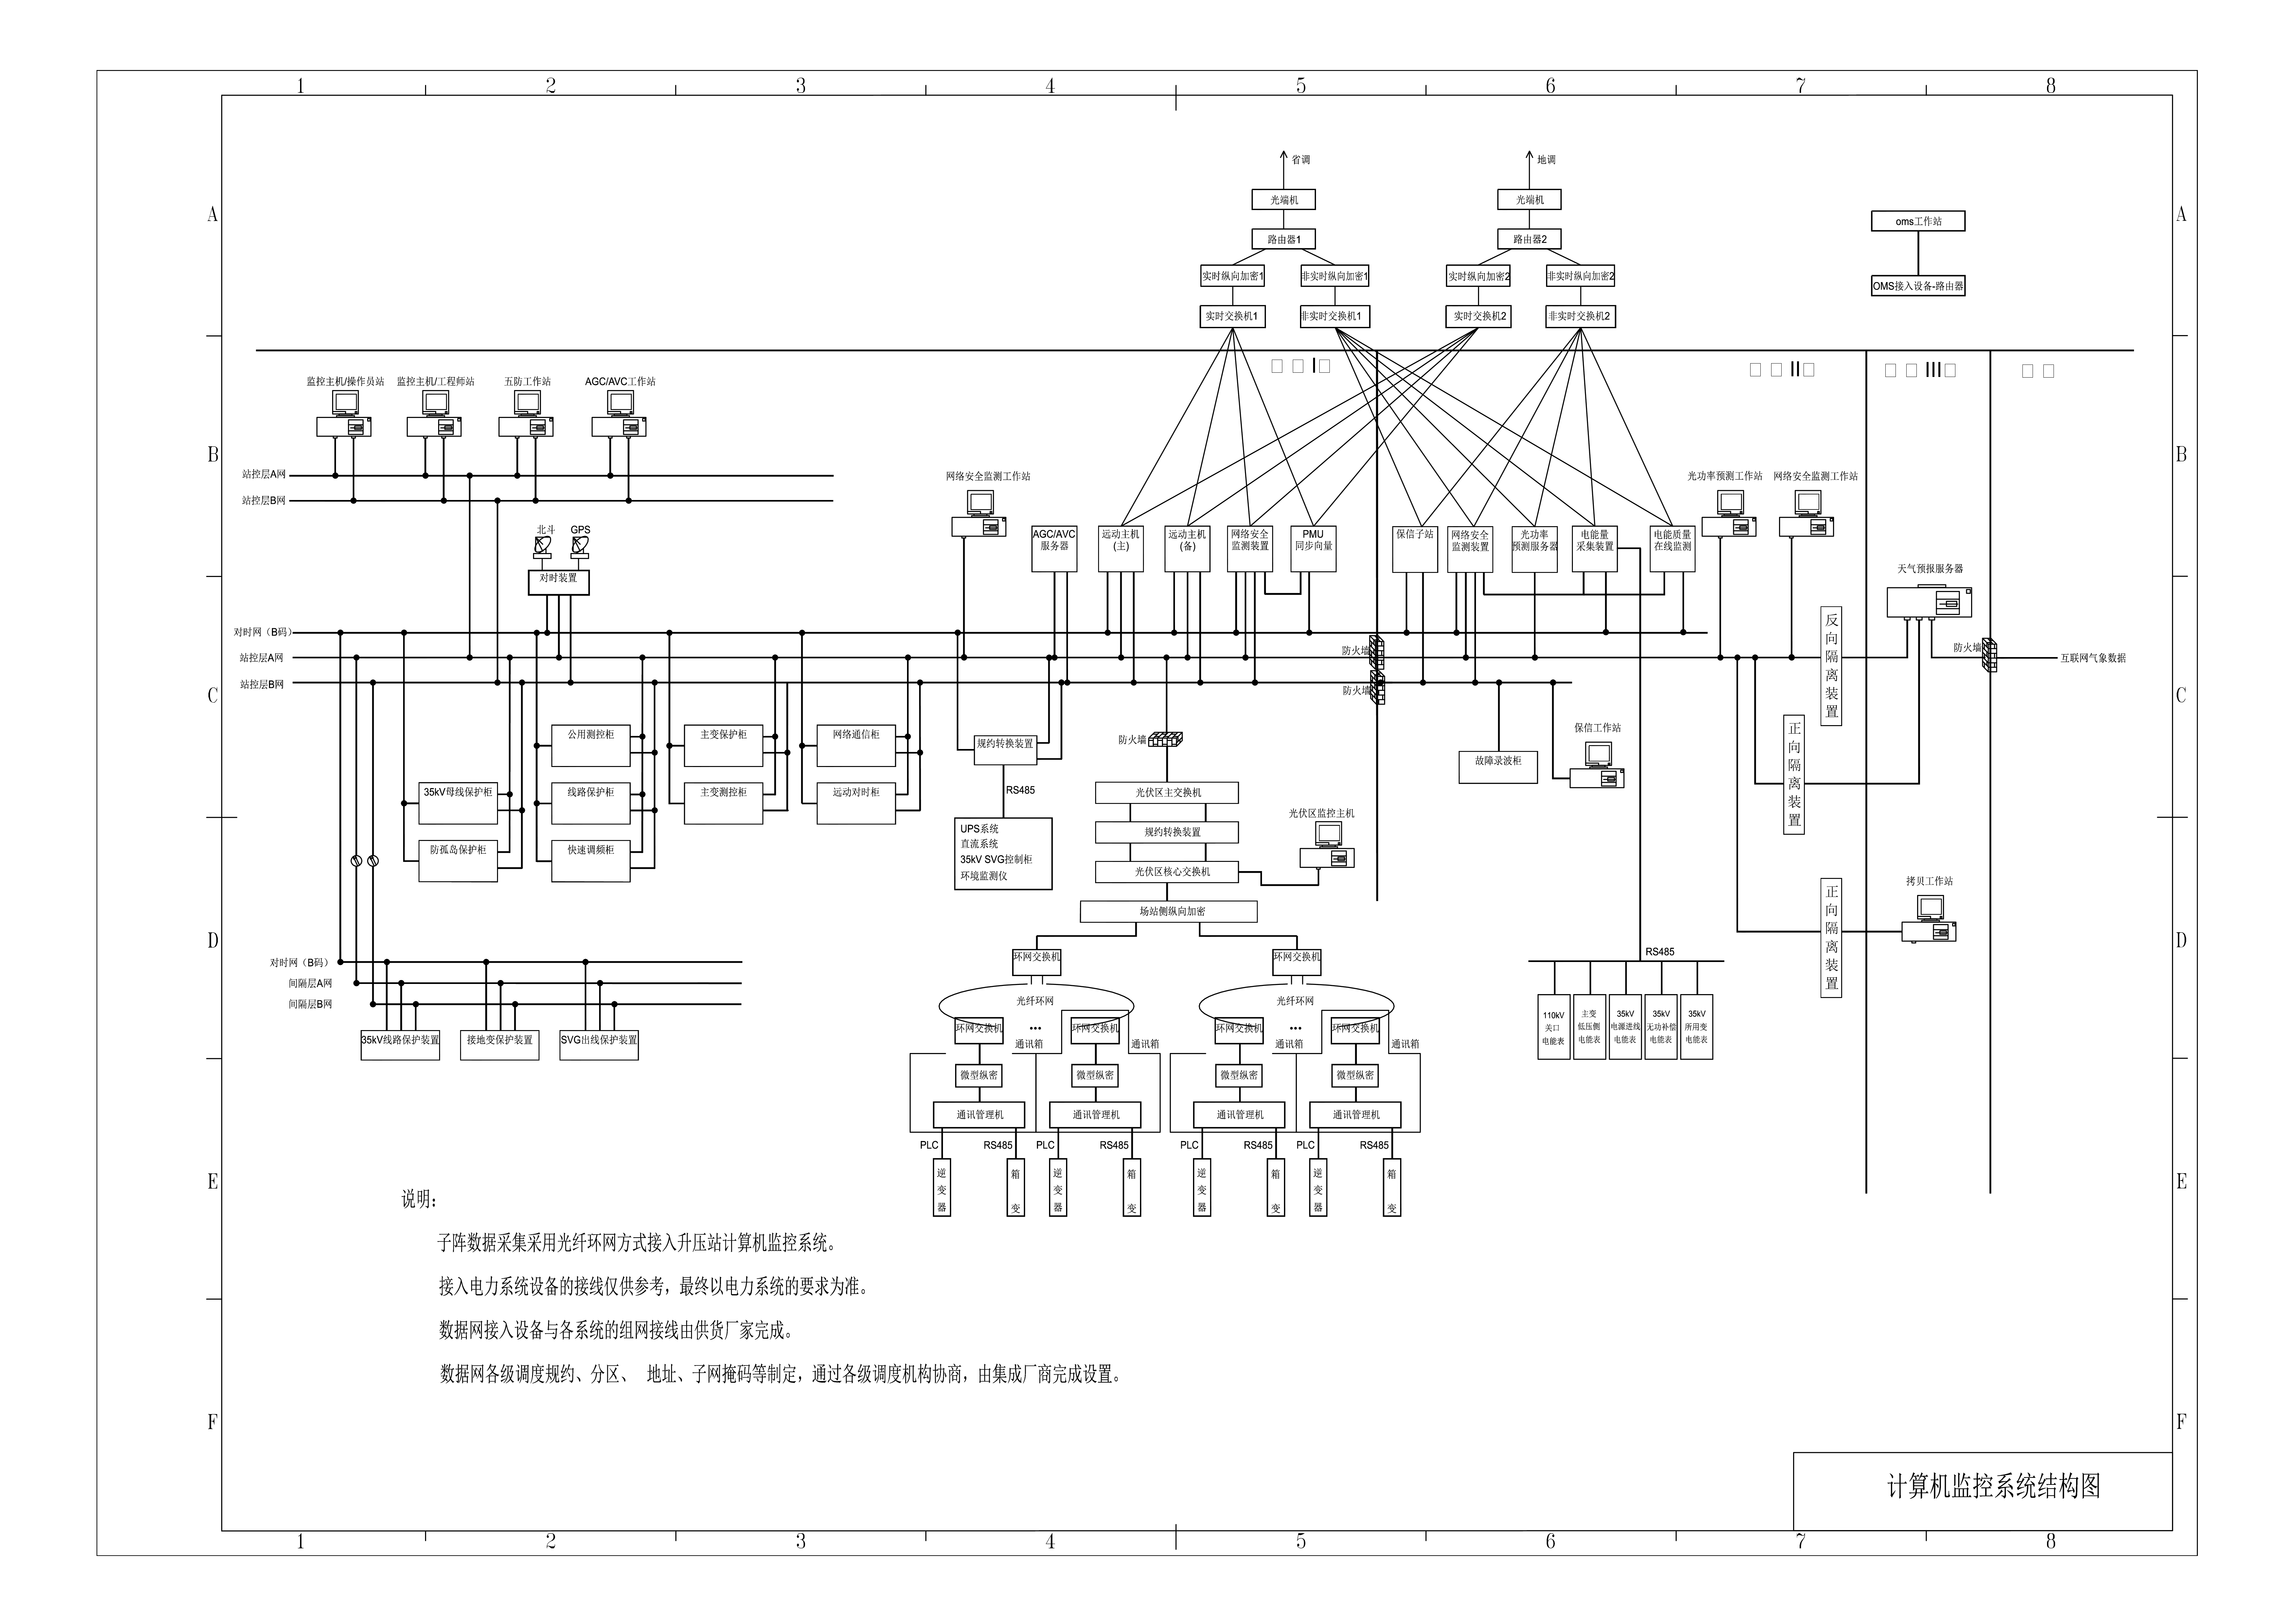
 2024-10-05 127
 -
华为防逆流装置讲解
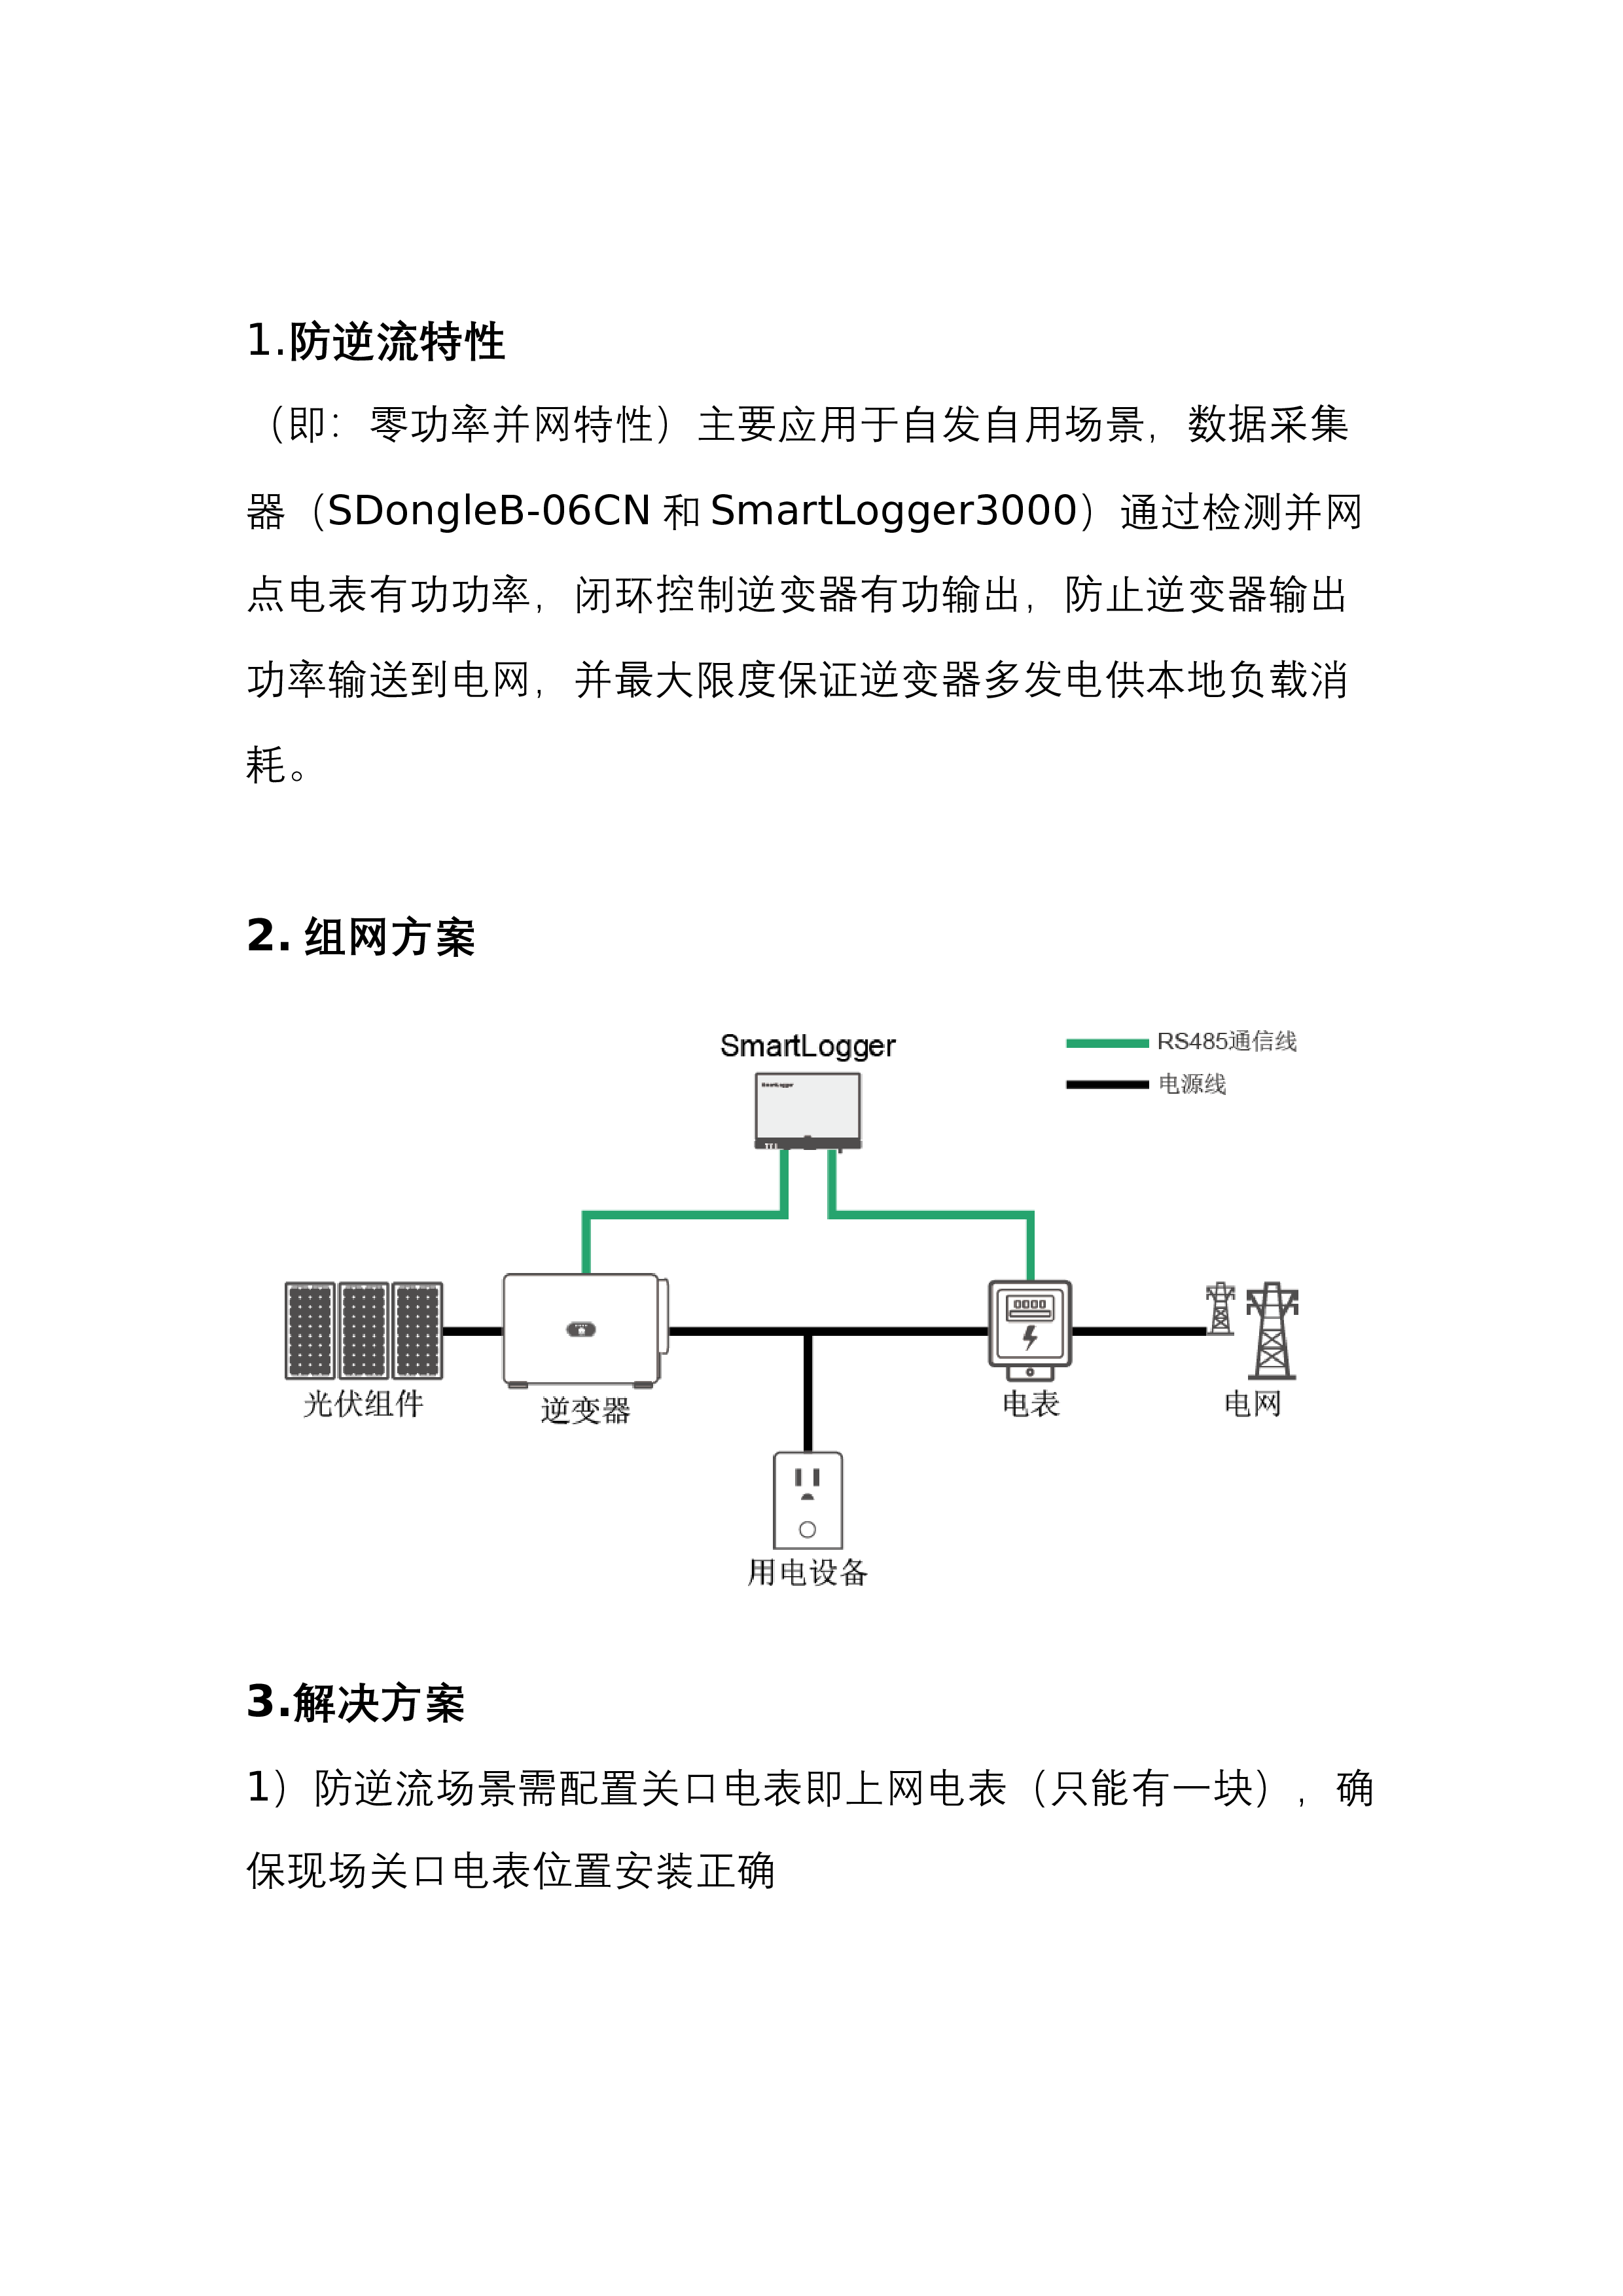 2024-12-03 329
 -
2025版+最新强制性条文汇编(2月4日更新)
 2025-02-24 282
 -
变压器互为备用研究
2025-03-13 56
-
ESPLAZA长时储能行业月报-2025年2月刊
 2025-03-28 79
 -
南方电网公司输变电工程造价控制线(2025 年)
 2025-08-21 276
 -
GB+20052-2024 电力变压器能效限定值及能效等级-副本
 2026-04-20 73
分类:实用文档
价格:10龙币
属性:88 页
大小:12.05MB
格式:PDF
时间:2026-07-10
相关内容
-

河北南网新能源电价信息表
分类:实用文档
时间:2026-08-12
标签:无
格式:PDF
价格:10 龙币
-
晶硅光伏组件和逆变器能效限定值及能效等级——报批稿——综合批注稿2(1)
分类:实用文档
时间:2026-08-12
标签:无
格式:PDF
价格:10 龙币
-

中国适应气候变化进展报告(2025)
分类:实用文档
时间:2026-08-12
标签:无
格式:PDF
价格:10 龙币
-

中国新型储能发展报告2026
分类:实用文档
时间:2026-08-12
标签:无
格式:PDF
价格:10 龙币
-
内蒙古自治区安全生产委员会办公室关于印发明确电化学储能电站安全管理职责和电化学储能电站消防安全管理若干措施的通知【2024-10-28】
分类:实用文档
时间:2026-08-12
标签:储能、安全、消防
格式:PDF
价格:免费
 冀公网安备13010802002329
